
Important Disclaimer
BatteryStorageHQ provides educational content and estimates only. We are not certified installers, financial advisors, or electricians. Always consult with licensed professionals.
An off-grid load calculation is a line-by-line table of every device you will run, its real running watts, and its hours per day — the product is your daily watt-hour demand, and it is the single number that sizes the entire system. Get it honest and everything downstream is arithmetic. Guess it, and you will under-build the bank and over-build the array, the two classic off-grid mistakes.
I build LiFePO4 banks from bare cells in Sweden and run my own house off a small array, a 16S bank, and a hybrid inverter, all logged in Home Assistant. Before any of that hardware existed, there was a load table — and it is the step I have watched more would-be off-gridders skip than any other. This guide is how I build that table so the result survives contact with a real January.
Why the Load Table Comes Before Everything
Your daily energy demand drives every other component: the battery bank is sized to carry it across your days of autonomy, the array is sized to refill it in your worst month, and the inverter is sized to the surge it produces. None of those numbers can be calculated until the load table exists. This is why I refuse to talk panel wattage with anyone until they have a table — the panel is the last number, not the first.
The cost of skipping it compounds. A load estimate that is 20% optimistic produces a bank 20% too small, autonomy that collapses a day early, and a generator running far more than planned. The table is also where you find the savings: the single biggest lever in off-grid design is reducing the load, because every watt-hour you remove is capacity you never have to build, store, and keep warm. The whole-system view in the off-grid power system guide starts here for exactly this reason.
Running Watts vs Surge Watts: The Distinction That Sizes Your Inverter
Every load has two numbers that matter: its steady running draw and its momentary surge at startup. Resistive loads — lights, a kettle, a laptop charger — draw the same watts the instant they switch on. Motor loads — a fridge compressor, a well pump, a power tool — pull a locked-rotor surge several times their running figure for a fraction of a second as the motor breaks free. Your watt-hour total uses the running figure; your inverter spec uses the surge.
This is why a load table needs a surge column, not just a watts column. A fridge that runs at 150 W might surge to 800 W or more for an instant; a deep-well pump running at 1,000 W can spike to several thousand. Add up the surges that can realistically coincide and you have the inverter’s minimum surge rating. I keep this column on every table I build because it is the number that decides whether the lights dim when the pump starts — and it feeds directly into what a battery system can actually power.
Measure, Don’t Guess: Using a Clamp Meter and a Plug Monitor
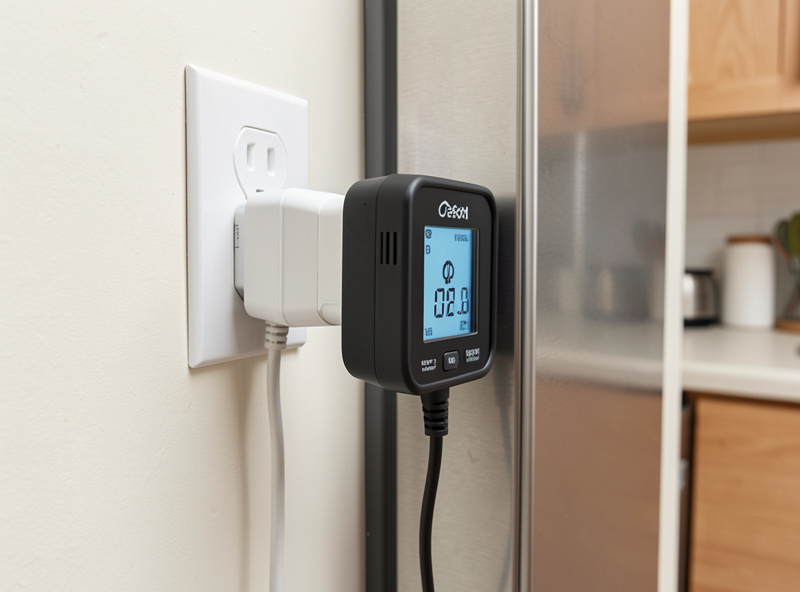
Nameplate ratings lie in your favour and against it. A device’s label shows its maximum draw, not its real average; a fridge labelled 150 W spends most of its day at zero because the compressor cycles. The honest figure for a cycling appliance is its energy over 24 hours, not its plate rating, and the only way to know it is to measure. A cheap plug-in energy monitor on an AC load, or a clamp meter on a DC circuit, turns guesswork into data.
On my own bench a clamp meter is permanent kit, and a plug-in watt-hour monitor lives on whichever appliance I am characterising. For a fridge I let it log a full day and read the watt-hours directly — that is the number that goes in the table, not the compressor’s running watts multiplied by an invented duty cycle. If you cannot measure a load yet, estimate conservatively and mark it to verify later; an honest unknown is safer than a confident wrong number. A reliable AC power meter is a worthwhile first purchase: a plug-in energy monitor pays for itself in avoided over-building. As an Amazon Associate I earn from qualifying purchases.
The Phantom Loads That Drain You Overnight
The loads that quietly wreck off-grid budgets are the ones that never switch off. An idling inverter draws a standby current to keep its electronics alive; a router, a Home Assistant box, a doorbell transformer, and every device on standby all pull a small steady draw 24 hours a day. Individually they are trivial; summed across a full day they set the floor your bank must carry through every dark hour with no sun to offset them.
In my own logs the overnight floor — inverter standby plus the always-on electronics — is a meaningful slice of the daily total, and it is the part that does not go away when you are frugal. This is why I split my load table into two tiers: always-on loads that run 24 hours, and intermittent loads that run on demand. The always-on tier sizes your overnight reserve; the intermittent tier sizes your peak. Treating them as one averaged blob hides both the reserve you need and the surge you must survive.
A Sample Off-Grid Load Table
Here is the shape of a real table for a modest off-grid cabin. The figures are illustrative — yours come from measuring your own devices — but the structure is exactly what I use. Note the separate surge column and the always-on rows that run a full 24 hours.
| Load | Running watts | Surge watts | Hours/day | Wh/day |
|---|---|---|---|---|
| LED lighting | 40 | 40 | 5 | 200 |
| Fridge (measured) | 150 avg | 800 | 24 cycling | 800 |
| Laptop and phone | 60 | 60 | 6 | 360 |
| Water pump | 700 | 2,500 | 0.5 | 350 |
| Inverter standby | 20 | 20 | 24 | 480 |
| Router and monitoring | 12 | 12 | 24 | 288 |
| Daily total | — | ~3,400 peak | — | ~2,478 Wh |
Two things jump out of that table. First, the standby and router rows together contribute nearly a third of the daily watt-hours despite drawing almost nothing at any instant — phantom loads are real. Second, the pump’s 2,500 W surge dominates the inverter spec even though its energy is small. Both insights come from the table’s structure, not from any single number.
From Daily Watt-Hours to a Bank Size
Once the table gives you a daily watt-hour figure, the bank follows in two steps: multiply by your days of autonomy, then divide by your usable depth-of-discharge. A 2,500 Wh/day demand at two days of autonomy is 5,000 Wh of usable energy; at an 80% working DoD for LiFePO4 that is a nominal bank of about 6,250 Wh. The same daily number, fed into a different autonomy target, gives a different bank — which is why days-of-autonomy sizing is the very next decision.
I always add a planning margin on top, because real loads grow — a new tool, a second fridge, a winter heater you swore you would not add. A table sized to today with no headroom is a table you will be rebuilding within a year. The detailed capacity arithmetic, including round-trip efficiency and temperature derating, lives in the battery storage sizing guide; this table is the input that makes that math meaningful rather than a guess.
Your Load Table Changes With the Seasons
A single load table is a snapshot, and off-grid loads are anything but static — especially at a northern latitude. The cruel irony of off-grid living is that demand peaks exactly when supply collapses: in deep winter the lights run far more hours, any electric heating or heat-tape draws hard, and the days you most need energy are the days the array produces least. A table built from summer habits will badly understate your winter demand.
I keep two columns of hours in my own working table — a summer figure and a winter figure — because lighting alone can more than double when daylight shrinks to a few hours. If you run any resistive heating off the system, even a small one, it will dominate the winter table and probably the whole design; this is the load that most often pushes a would-be off-gridder toward a generator or a non-electric heat source instead. Build the table for your worst month, not your easiest, and the rest of the system design rests on honest ground. The seasonal collapse on the supply side is covered in winter off-grid solar sizing.

Frequently Asked Questions
How do I calculate my off-grid energy needs?
List every device, record its real running watts and its hours of use per day, multiply the two for watt-hours, and sum the column. Measure cycling appliances like fridges over a full day rather than using their nameplate rating. The total daily watt-hour figure is what sizes your battery bank and solar array.
Should I use nameplate watts or measured watts?
Measured, wherever possible. Nameplate ratings show maximum draw, not real average consumption. A fridge labelled 150 watts spends most of the day at zero because its compressor cycles, so its true daily energy is far lower than nameplate times 24. A plug-in energy monitor gives the honest figure.
What are phantom loads and why do they matter off-grid?
Phantom loads are devices that draw power continuously: inverter standby, routers, monitoring electronics, and anything on standby. Each is tiny, but running 24 hours a day they often add up to a third of the daily total and set the overnight reserve your bank must carry with no sun to offset them.
Why does my load table need a surge column?
Motor loads like pumps and compressors draw a locked-rotor surge several times their running watts at startup. Your watt-hour total uses running watts, but your inverter must be sized to the combined surge that can occur at once. Without a surge column you will undersize the inverter and brown out when the pump starts.
How much margin should I add to my load calculation?
Add a planning margin of roughly 20 to 30 percent above today’s measured total. Real loads grow as you add tools, appliances, and winter heating, and a system sized with no headroom needs rebuilding within a year. It is far cheaper to plan headroom than to re-cell a bank later.
Related Guides
The load table is step one of the whole-system design sequence. Once you have your daily watt-hours, set your days of autonomy, run the battery sizing math, decide between off-grid, grid-tie, or hybrid, and sanity-check it against what a battery system can really power.