Important Disclaimer
BatteryStorageHQ provides educational content and estimates only. We are not certified installers, financial advisors, or electricians. Always consult with licensed professionals.
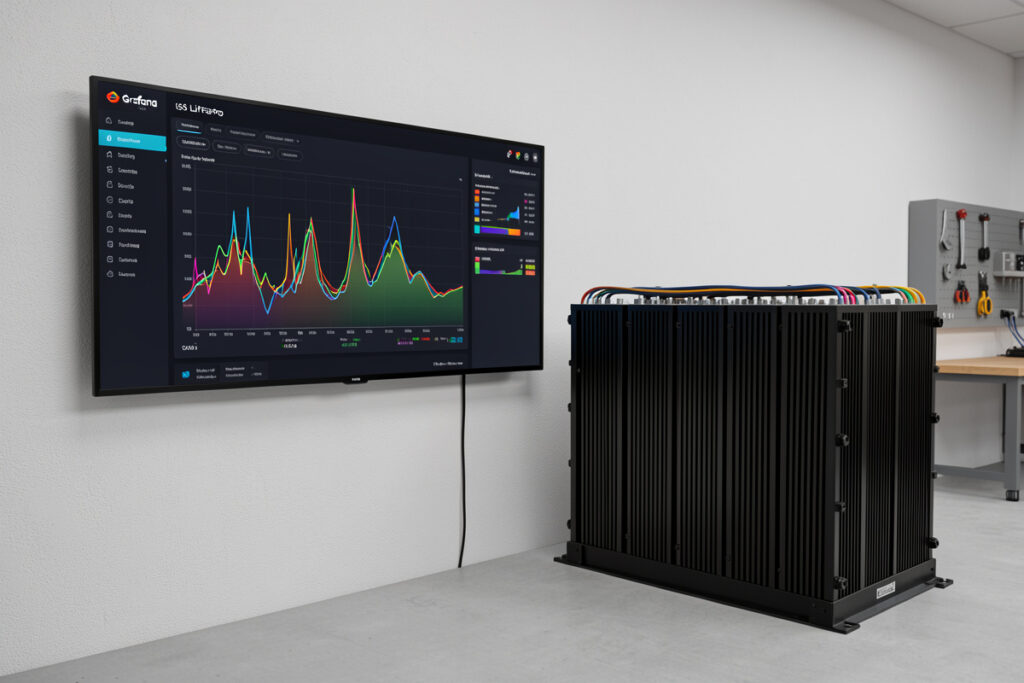
A Bluetooth app shows you a battery’s state right now; a time-series stack shows you the trend. On my bench, a 12 mV cell-delta creep that took six weeks to surface would have been invisible in any snapshot. InfluxDB plus Grafana caught it because it never stopped logging.
This is a build guide for getting your battery telemetry into InfluxDB and onto Grafana panels worth looking at. It is the same stack I run on my 16S 280Ah EVE LF280K bank, and the same rule engine that watches my hydro reservoir level and the humidity in my curing chamber. Once it exists, every sensor you own ends up on it.
Why a time-series stack beats Bluetooth snapshots
A snapshot tells you the pack is at 53.1V and SoC 74% this second. A time-series database tells you cell 9 has drifted 8 mV further from the pack mean every month for three months. That slow divergence is the signal you actually care about, and it only shows up across weeks of stored data.
The JK BMS app on my phone is fine for a quick look, but it forgets everything the moment I close it. With grafana influxdb battery monitoring I can overlay PV input against depth-of-discharge across a full season, see exactly which cloudy stretch pushed my bank past 80% DoD, and correlate a temperature dip with a charge-current cutback. None of that is answerable from a Bluetooth read. The point of the stack is memory: coulomb counting, cell drift, and load patterns become a queryable history instead of a number that vanishes.
I treat the database as the source of truth and the BMS as a sensor. The BMS still does protection — that job never leaves the BMS — but the long-term forensics live in InfluxDB. If you want the conceptual map of how monitoring fits the whole system, the battery monitoring guide is the hub I hang all of this off.
There is a second, less obvious payoff: capacity tracking. By integrating pack current over a full charge-discharge cycle in InfluxDB, I get a coulomb-counted usable-capacity figure I can plot month over month. On a fresh LFP bank that line is flat; the day it starts trending down is the day you have real evidence of aging, not a vibe. A Bluetooth app will never give you that because it never holds two cycles in memory at once. This is the difference between guessing your bank is fine and being able to point at a year of stored data that says so.
Choosing your data pipeline
There are three realistic ways to get battery data into InfluxDB: pull it from a Victron Cerbo GX / VRM, read your BMS directly over serial or Modbus with a Raspberry Pi, or publish from an ESP32 over MQTT. Pick by what hardware you already own and how much you want to wire yourself.
The Victron route is the least effort. If you run a Cerbo GX, it already speaks MQTT locally and pushes to VRM, so you point a small script — or Telegraf — at the Cerbo’s MQTT broker and you have pack voltage, current, SoC, and PV yield landing in InfluxDB within an afternoon. It is the path I recommend to anyone whose system is already Victron-centric, and it pairs naturally with the Victron BMV shunt monitor guide for accurate coulomb-counted SoC.
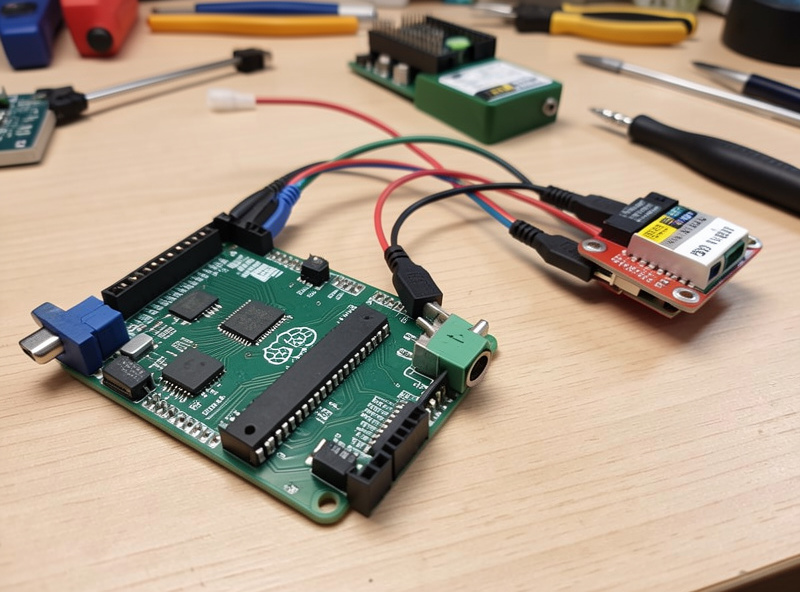
The BMS-over-Modbus route is what I run on the main bank. A Raspberry Pi with a cheap USB-to-RS485 adapter polls my JK BMS for per-cell voltages, then writes them to InfluxDB. This is the only path that gives you all 16 cell voltages individually — VRM gives you pack-level data, but cell drift forensics need cell-level resolution. If you are deciding which physical bus to use, the CAN and RS485 battery communications breakdown covers the wiring and protocol choices.
The ESP32 + MQTT route is the cheapest and most flexible. A €6 ESP32 reading a shunt amplifier or sniffing the BMS UART, publishing JSON over MQTT, is genuinely capable — it is how I instrument the curing chamber and the reservoir. The tradeoff is you are now maintaining firmware. As an Amazon Associate I earn from qualifying purchases. A basic Raspberry Pi 4 starter kit is the single most useful purchase here if you want one box running InfluxDB, Grafana, and the poller together.
| Data source | Effort | Rough cost | Data granularity | Offline-capable |
|---|---|---|---|---|
| Victron Cerbo / VRM (MQTT) | Low | Cerbo you already own | Pack-level: V, A, SoC, PV | Yes (local MQTT) |
| BMS over Modbus + Raspberry Pi | Medium | ~€60 Pi + ~€10 RS485 | Per-cell V, temps, current | Yes (fully local) |
| ESP32 + MQTT | Medium-high (firmware) | ~€6 ESP32 + sensors | Whatever you wire | Yes (local broker) |
Getting data into InfluxDB
InfluxDB stores measurements as line protocol: a measurement name, tags, fields, and a timestamp. You write into a bucket, and each bucket carries a retention policy. Get the schema and retention right at the start, because reorganizing a year of data later is miserable.
My write looks like battery,cell=09 voltage=3.341 1718960000 — measurement battery, a cell tag so I can group all 16, and a voltage field. I keep separate measurements for pack-level data (current, SoC, PV watts) and cell-level data, because they log at different rates: pack current every few seconds, per-cell voltage every 30 seconds is plenty. Over-sampling cell voltage just inflates the database without telling you anything new — drift is slow.
Use two buckets if you can: a high-resolution one with short retention (say 30 days) and a downsampled long-term one (1-minute or 5-minute means, kept for years). InfluxDB tasks handle the downsampling automatically. This is the single gotcha people skip, and it is why their database balloons and queries crawl after a few months. The reservoir and curing-chamber data share the same pattern on my box — raw for a month, aggregated forever.
Building Grafana panels worth having
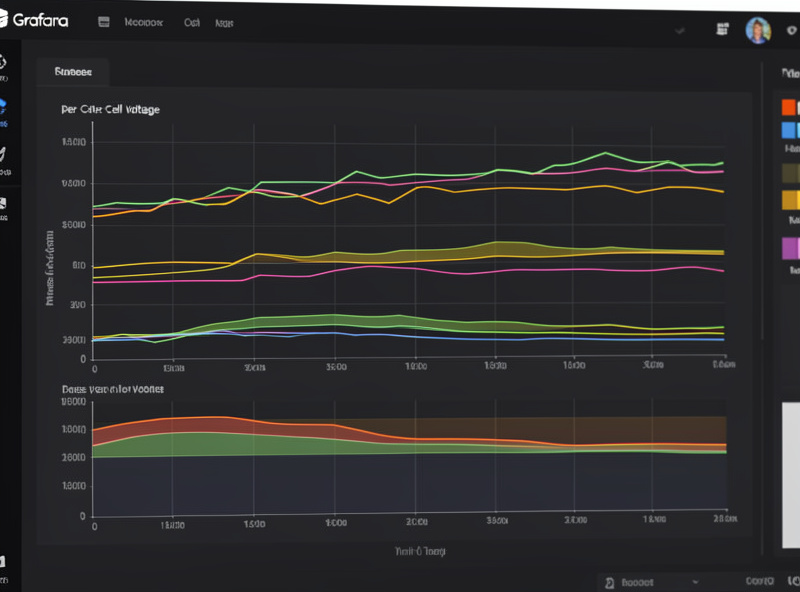
Grafana queries InfluxDB and draws the panels. The dashboard I actually look at has six panels: per-cell voltage with min/max bands, cell-voltage delta, SoC, pack current, daily PV Wh, and temperature. Everything else is noise I removed after the novelty wore off.
The most valuable panel by far is cell-voltage delta — max cell minus min cell, plotted over time. A healthy LFP pack sits within a few millivolts under load; a delta that grows steadily, especially near top-of-charge, is your early warning that a cell is weakening or your balancer can’t keep up. I have a min/max shaded band on the per-cell voltage panel so a single outlier cell jumps out visually without me reading 16 lines.
For SoC I trust the shunt-derived coulomb count over the BMS’s voltage estimate, which is why the BMV pairs so well here. Daily PV Wh I render as a bar chart, one bar per day, which makes seasonal patterns obvious at a glance. Pack current as a filled area shows charge/discharge cycles cleanly. None of these need fancy queries — most are a simple mean or last over a time window. If you want this driving actions rather than just displaying, my Home Assistant battery automation setup reads the same data and acts on it.
Alerting that earns its keep
Grafana’s alerting fires on a query crossing a threshold. The alerts worth setting are the ones that catch a real fault early: cell-delta over a limit, any cell above or below safe LFP voltage, and high cell temperature. Skip the noisy ones — you will mute them and miss the real one.
My rules: alert if cell delta exceeds 50 mV, if any cell drops below 2.9V or climbs above 3.55V, and if any cell temperature crosses a sane ceiling. Critically, the BMS still owns hard protection — it cuts the contactor at the real limits regardless of Grafana. The Grafana alert is the early warning that lets me intervene before the BMS ever has to act. I send notifications to a phone channel, and I keep the thresholds loose enough that an alert always means something. For pulling this in from a system you aren’t standing next to, the remote battery monitoring setup covers secure access.
One alert I added after the fact has earned its place: a stale-data alert. If InfluxDB stops receiving points from the poller for more than a few minutes, Grafana tells me. A dashboard that goes quiet looks identical to a healthy one — flat lines — until you realize the flat line is a dead poller, not a calm bank. Catching a wedged Raspberry Pi or a dropped RS485 link the moment it happens has saved me from a multi-day gap in the very history I built the stack to keep. The under-load delta also climbs as a bank ages, so I watch its baseline as well as its peaks.
Where to run it: Raspberry Pi vs NAS or mini-PC
A Raspberry Pi 4 with 4GB runs InfluxDB, Grafana, and a poller comfortably for a single bank. If you are already logging a house full of sensors, or want years of high-resolution retention, a NAS or a small mini-PC gives you the headroom and the disk redundancy you’ll eventually want.
I started on a Pi and moved the database to a mini-PC once I was logging three subsystems at once. The Pi is perfectly capable; the reason to move is storage and the comfort of not running a time-series database off an SD card — use an SSD on the Pi from day one if you stay there. On a NAS you get ZFS or RAID under the data, which matters once the history itself becomes valuable. Either way, keep the BMS and inverter telemetry flowing even if the dashboard host reboots — the data should buffer or the BMS should keep protecting regardless of whether your charts are up. This same box also feeds my smart inverter monitoring panels.
The gotchas that bite
Three things will quietly ruin your data: clock sync, retention policy, and downsampling. Get NTP running on every device that writes timestamps, set retention before you log a single point, and downsample early. Each of these is invisible until you’ve got months of data and discover it’s wrong.
Clock drift is the sneakiest. If your ESP32’s clock is off, its points land in the wrong spot on the timeline and your PV-versus-load correlations are garbage. Run NTP everywhere. Retention I covered — never leave a bucket on infinite raw retention. And understand your BMS: if you’re reading per-cell data, you need to know the register map, which is exactly the kind of thing the understanding your BMS guide lays out. Build the stack once, get these three right, and it will run for years telling you things no app ever could.
Do I need InfluxDB, or can Grafana store the data itself?
Grafana only visualizes — it does not store time-series data. You need a database behind it, and InfluxDB is the natural fit for battery telemetry because it is purpose-built for timestamped measurements, retention policies, and downsampling that keep months of cell data fast to query.
Can I get per-cell voltages from Victron VRM?
No. VRM and the Cerbo give you pack-level data: voltage, current, SoC, and PV yield. For individual cell voltages you have to read the BMS directly over serial or Modbus, typically with a Raspberry Pi, since that is the only device that knows each cell.
How often should I log per-cell voltage?
Every 30 seconds is plenty for cell voltage because drift is slow and over-sampling just bloats the database. I log pack current faster, every few seconds, since it changes quickly, and I downsample everything to one-minute means for long-term storage.
Does Grafana alerting replace my BMS protection?
Never. The BMS owns hard protection and cuts the contactor at real limits no matter what. Grafana alerting is an early warning that fires before those limits, letting you intervene first. Treat the database as forensics and the BMS as the safety device.
Will a Raspberry Pi handle InfluxDB and Grafana together?
Yes, a Pi 4 with 4GB runs InfluxDB, Grafana, and a poller for a single bank comfortably. Use an SSD instead of an SD card from day one. Move to a NAS or mini-PC only when you want years of retention or disk redundancy.
What is the single most useful Grafana panel for a LiFePO4 bank?
Cell-voltage delta — max cell minus min cell over time. A healthy LFP pack stays within a few millivolts under load, so a steadily growing delta near top-of-charge is your earliest warning of a weakening cell or a balancer that cannot keep up.