Important Disclaimer
BatteryStorageHQ provides educational content and estimates only. We are not certified installers, financial advisors, or electricians. Always consult with licensed professionals.
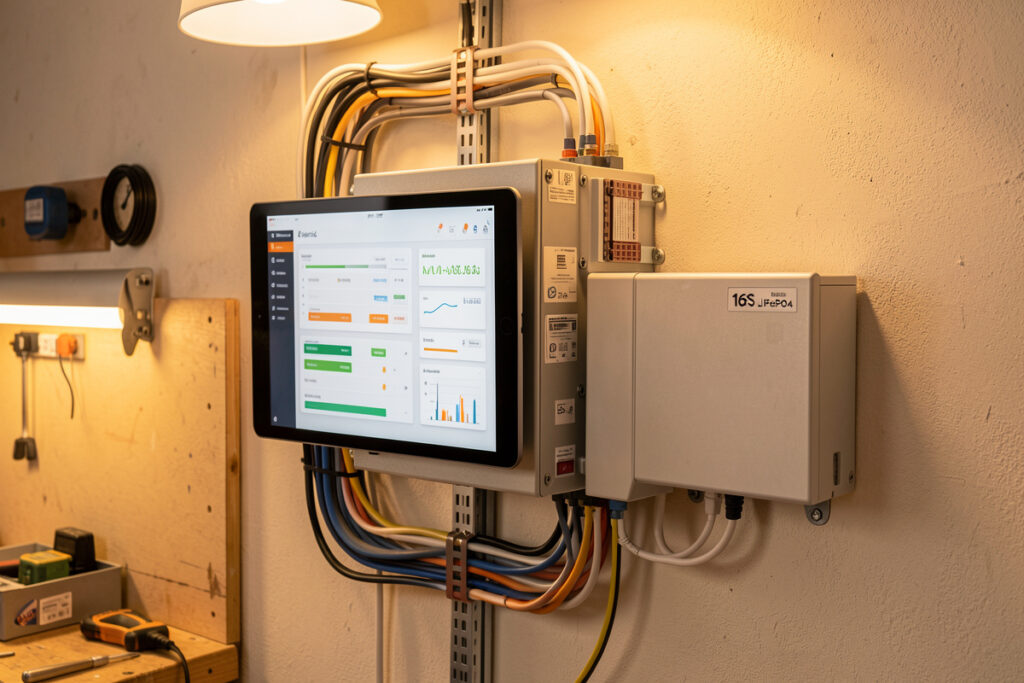
Battery monitoring is the difference between a bank you trust and a bank you guess at. A complete monitoring stack answers three questions in real time: how full the bank is (state of charge), whether any single cell is drifting out of line, and whether the charge and discharge currents are inside safe limits. On my 16S LiFePO4 bank I run all three layers at once, and the cost of doing it properly is under $250.
This is the guide I wish I’d had when I wired my first pack. There is a lot of noise online about “smart” batteries and apps, and most of it skips the part that actually keeps a bank alive: knowing the per-cell voltage and the true coulomb count, not just a guessed percentage on a phone screen. Below I walk through every layer of monitoring I run, from the BMS itself up to a full Home Assistant rule engine, and link out to the deep-dive guide for each piece.
What Battery Monitoring Actually Measures
Good battery monitoring tracks four things continuously: pack voltage, current (in and out), individual cell voltages, and temperature. From those raw numbers everything else is derived — state of charge, state of health, remaining runtime, and the alarms that protect the bank. A monitor that shows only a percentage is hiding the data you actually need.
The trap most beginners fall into is trusting a voltage-based fuel gauge on LiFePO4. The flat discharge curve of LFP means the bank sits near 13.2 V (for a 4S 12 V pack) from roughly 90% down to 20% state of charge. Voltage alone simply cannot resolve where you are on that plateau. That is why coulomb counting — measuring every amp-hour that flows in and out through a precision shunt — is the only honest way to read SoC on a lithium bank. I cover the math and the recalibration routine in the state of charge calibration guide.
Cell-level monitoring is the other non-negotiable. A pack is only as strong as its weakest cell, and a single lagging cell will hit the high-voltage cutoff first on charge and the low-voltage cutoff first on discharge, robbing you of usable capacity long before the BMS ever faults. Watching per-cell voltage is how you catch cell drift early, while it is still a balancing problem and not a dead cell.
Layer One: The BMS Is Your First Monitor
Every lithium bank needs a battery management system, and the BMS is also your cheapest, most fundamental monitoring tool. It already measures per-cell voltage, pack current, and temperature because it needs those values to do its protective job. The only question is whether you can see that data, and how.
The JK BMS I run as my daily driver reports all sixteen cell voltages, balance current, pack current, temperature, and a calculated SoC over both a screen and Bluetooth. A bare-bones Daly will protect the pack but gives you far less visibility, which is one of several reasons I’ve soured on it for high-current home builds. Before you buy anything else, understand what your BMS already exposes — start with what a BMS actually does and then the BMS selection and wiring guide for choosing one whose telemetry you can live with.
One safety note that belongs here: the BMS is a protection device, not a charge controller. It is the last line of defense, not the thing you tune your daily charge cutoffs against. If your BMS is regularly tripping on a high-voltage event, your charge profile is wrong, or a cell is drifting — that is exactly the kind of signal good monitoring surfaces before it becomes a fault.
Layer Two: The Shunt-Based Battery Monitor
A dedicated shunt monitor is the heart of accurate state-of-charge reading. It sits a precision resistor (the shunt) in the negative line of the bank and measures the tiny voltage drop across it to calculate current with high accuracy, then integrates that current over time to count amp-hours. The Victron BMV-712 and the SmartShunt are the reference designs here, and they are what I measure other monitors against.
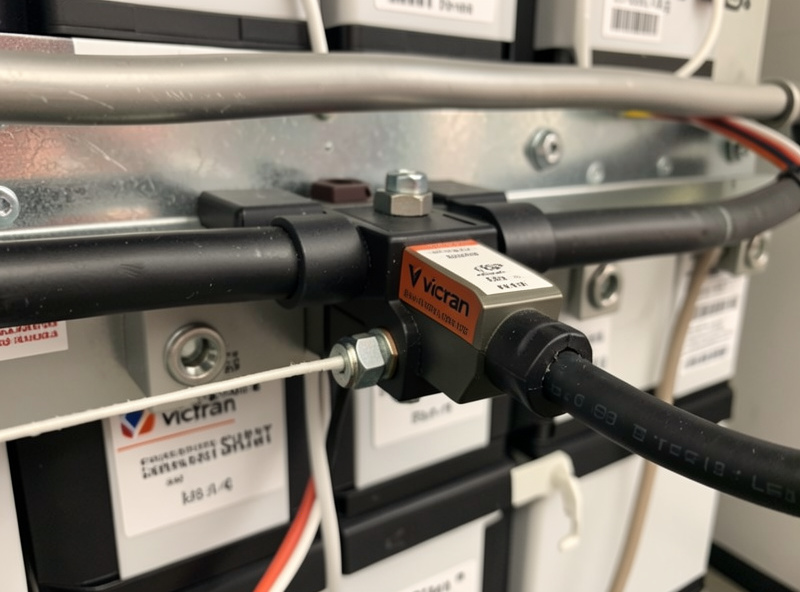
The reason a good shunt beats a BMS-calculated SoC is precision and isolation. The shunt measures total bank current at a single point with a low-tolerance resistor, independent of the BMS, and it lets you set the battery’s full-charge detection parameters (charged voltage, tail current, charge efficiency factor) so the count re-syncs to 100% on every full charge. That self-correction is what keeps the percentage honest over weeks of partial cycling. I walk through installation, the Peukert and charge-efficiency settings, and Bluetooth setup in the Victron BMV and SmartShunt guide.
If you only add one thing beyond your BMS, make it a shunt monitor. A Victron SmartShunt is the single highest-value monitoring upgrade for most home banks. As an Amazon Associate I earn from qualifying purchases.
Layer Three: Bluetooth Apps and Phone-Based Monitoring
Almost every modern smart BMS and shunt ships with a Bluetooth Low Energy app, and for a lot of people that is the entire monitoring stack. It is genuinely useful: walk up to the bank, open the app, and see live cell voltages and current in seconds. The JK, JBD/Overkill, and Daly apps all do this, with very different polish.
The honest limitation is range and logging. Bluetooth gives you a snapshot when you are standing near the bank; it does not give you a record, an alert when you are away, or a trend you can scroll back through. It is a commissioning and spot-check tool, not a true monitoring system. I cover which apps are worth your time, the security caveats of leaving BLE open, and how to get the most out of them in the BMS Bluetooth app guide.
Layer Four: CAN Bus and RS485 Communications
This is where DIY storage gets serious. CAN bus and RS485 are the wired communication protocols that let your BMS talk directly to your inverter and to logging hardware. When a BMS speaks CAN to a compatible hybrid inverter, the inverter stops guessing from voltage and instead takes real SoC, charge-current limits, and charge-voltage targets straight from the pack. That closed loop is how a commercial-grade install behaves, and you can build it yourself.
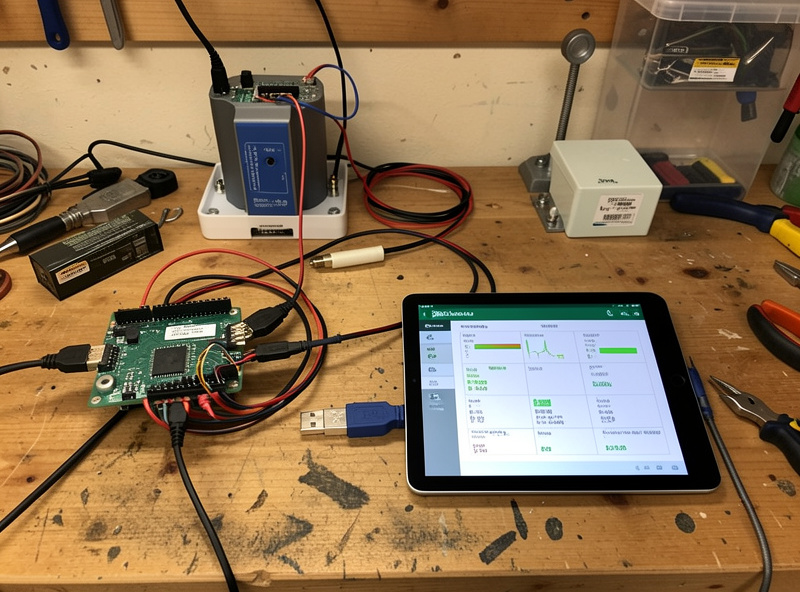
RS485, meanwhile, is the workhorse for getting data out to a logger or a single-board computer. Many BMS boards expose a Modbus-over-RS485 interface that a Raspberry Pi can poll every few seconds. Getting the wiring, termination resistors, and protocol mapping right is fiddly the first time, which is why I wrote the CAN and RS485 battery communications guide as a step-by-step. If your inverter and BMS are on the closed-loop compatibility list, this is the single biggest upgrade to how your system behaves under load.
Layer Five: Logging and Dashboards With Grafana and InfluxDB
A snapshot tells you the present; a time-series database tells you the truth over months. Once you are pulling data off the BMS and shunt, the natural home for it is InfluxDB (a database built for timestamped measurements) visualized through Grafana (the dashboard layer). This is the same stack I use to watch the hydro reservoir levels and the curing-chamber humidity — one logging philosophy for everything in the workshop.
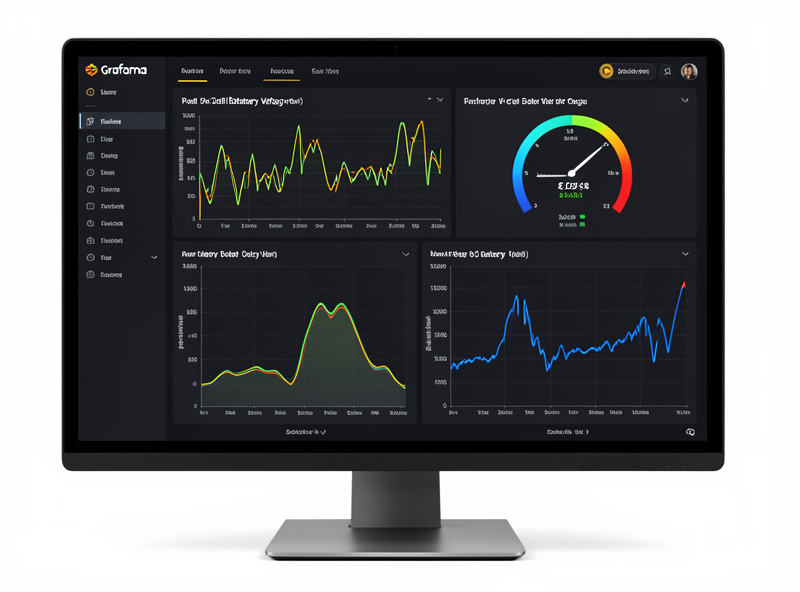
What this buys you is pattern recognition. With months of logged per-cell data I can see a cell that is slowly diverging on every charge — long before it ever trips a balance alarm. I can correlate a bad solar day against actual depth of discharge, and I can prove whether a new charge profile actually reduced cell drift. None of that is possible from a Bluetooth snapshot. The build — from getting data into InfluxDB to building the panels — is in the Grafana and InfluxDB monitoring guide, and it pairs naturally with Wi-Fi and MQTT inverter monitoring.
Layer Six: Remote Monitoring When You’re Away
Local dashboards are great until you leave the house. Remote monitoring is what lets you check the bank from your phone on the other side of the country and, more importantly, get an alert pushed to you the moment something is wrong. For an off-grid-leaning system that backs critical loads, that alerting is the whole point.
There are two honest routes: a vendor cloud (Victron’s VRM portal is the gold standard, free, and genuinely good) or a self-hosted path that exposes your own dashboard securely. Each has real tradeoffs around privacy, reliability, and what happens when the internet drops. I lay out both, plus the alerting logic that actually matters — low SoC, high cell-voltage delta, over-temperature — in the remote battery monitoring setup guide.
Layer Seven: State of Charge Calibration
Even a good coulomb counter drifts. Every charge and discharge has small inefficiencies the counter cannot perfectly capture, so the SoC reading slowly accumulates error over weeks of partial cycling. Calibration is the routine that re-syncs the count to reality, and it is the most-skipped maintenance step in DIY storage.
The fix is simpler than it sounds: let the bank reach a genuine, settled full charge so the monitor’s “charged” detection fires and resets the count to 100%. Getting the charged-voltage and tail-current thresholds right is what makes that reset trustworthy. The full routine, including how often LFP actually needs it, is in the state of charge calibration guide, and it connects directly to your long-term maintenance routine.
Layer Eight: Home Assistant and Automation
The top of the stack is automation: not just watching the bank, but having the system act on what it sees. Home Assistant is where my battery data meets the rest of the workshop. The same rule engine that reads per-cell voltage and SoC also decides when to shed non-critical loads, when to fire the generator-start relay in a deep winter lull, and when to push a notification to my phone.
This is the genuine payoff of all the layers below it. Once the data is flowing into Home Assistant — over MQTT, CAN, or a community integration — you can write rules like “if SoC drops below 30% and it’s after sunset, shut off the non-essential circuit” or “if any cell-voltage delta exceeds 50 mV, alert me.” I cover the integrations, the entities worth tracking, and a starter set of automations in the Home Assistant battery automation guide.
Comparing the Monitoring Methods
No single method does everything. The right stack layers a couple of these together — a shunt for accuracy, a logger for history, and remote alerting for peace of mind. Here is how the main approaches stack up:
| Method | SoC Accuracy | Data Logging | Remote Access | Cost (USD) | Best For |
|---|---|---|---|---|---|
| BMS screen / app only | Fair (voltage-biased) | None | No (BLE only) | $0 (included) | Spot checks at the bank |
| Shunt monitor (BMV/SmartShunt) | Excellent (coulomb count) | Limited history | BLE, or cloud via add-on | $70–130 | Accurate SoC for any bank |
| RS485/CAN to Raspberry Pi | Excellent | Full (with database) | Yes (self-hosted) | $60–100 + time | DIY data nerds |
| Grafana + InfluxDB | Inherits source | Excellent (months) | Yes (secured) | $0 software | Trend analysis |
| Vendor cloud (Victron VRM) | Excellent | Excellent | Yes (turnkey) | $0 with hardware | Set-and-monitor reliability |
| Home Assistant | Inherits source | Excellent | Yes (self-hosted) | $0–100 hardware | Automation + whole-home |
What a Complete Monitoring Stack Actually Costs
The “under $250” I opened with is not a round-number guess — it is what these layers add up to when you build the way I did, reusing the BMS the bank needs anyway. Monitoring is the cheapest insurance in the whole system: a small fraction of what the cells cost, and the thing that protects that investment.
Here is the real breakdown on my bench, in USD. The BMS is $0 in this accounting because the bank needs one regardless — the JK BMS I run is around $90–110 on its own, but that is a protection cost, not a monitoring cost. The monitoring spend that sits on top is a Victron SmartShunt at roughly $120, a Raspberry Pi 4 with an SSD and a USB-to-RS485 adapter at about $90, and $0 of software because InfluxDB, Grafana, and Home Assistant are all free and open-source. That is roughly $210 for a stack that gives me coulomb-accurate SoC, months of per-cell history, and remote alerting — comfortably under the $250 line.
You can spend less. Stop at the shunt and its free Bluetooth app and you are at about $120 for an honest SoC reading, which for a fridge-and-lights bank is genuinely the finish line. You can also spend more: a Victron Cerbo GX instead of the Pi adds turnkey VRM cloud logging but roughly doubles the hardware cost. What you should not do is spend nothing and trust the inverter’s voltage-flavored percentage — that is the false economy that costs you a prematurely aged cell you never saw coming. The cells in my bank are where the real money sits; $200 of monitoring to protect a $1,000-plus pack is not a hard call.
How I’d Build a Monitoring Stack From Scratch
If I were starting today, I would build it in this order, stopping whenever the visibility is enough for how I use the bank. First, learn to read what the BMS already reports over its app — free, immediate. Second, add a shunt monitor for an honest SoC; for most people that is the finish line. Third, if you have a compatible inverter, wire the CAN closed loop so the inverter stops guessing. Fourth, stand up logging in Grafana/InfluxDB or Home Assistant once you want history and automation. Fifth, layer remote alerting on top so the system reaches out to you instead of the other way around.
The whole point is graduated cost and effort matched to consequence. A bank that runs a fridge and some lights needs less than a bank that is the only thing standing between the workshop and a dead grid in January. Build to your actual loads — the same honest sizing philosophy behind what a battery system can really power.
Temperature Monitoring and the Alarms That Actually Matter
Temperature is the quietest killer in a lithium bank and the easiest signal to ignore until it bites. For LiFePO4 the single most important rule is charge temperature: never charge below freezing. Charging LFP below 0 °C plates metallic lithium onto the anode, causing permanent capacity loss and a real internal-short risk that no amount of monitoring undoes after the fact. That is why my bank’s automation hard-blocks charging on a low-temperature reading rather than just warning me — the deeper logic is in the BMS charge-temperature cutoff guide.
Most BMS boards carry only two or three temperature probes, which is enough for protection but coarse for diagnosis. If you log temperature alongside current in Grafana, a probe that climbs faster than its neighbors under the same load points you straight at a high-resistance connection — usually an under-torqued busbar or a corroding lug. I have caught exactly that, and it would have stayed invisible on a phone snapshot.
When it comes to alarms, resist the urge to alert on everything; you will train yourself to ignore the notifications. The four alerts that earn their place are: low state of charge (so you can shed load before the BMS does it for you), high cell-voltage delta (the early warning of cell drift, typically anything over 50 mV at rest), over-temperature on charge, and any BMS protection trip. Everything else is a dashboard metric, not an alert. Getting that signal-to-noise ratio right is what makes remote monitoring something you actually trust instead of something you mute.
Frequently Asked Questions
Do I need a separate battery monitor if my BMS has Bluetooth?
For accurate state of charge, yes. A BMS calculates SoC mostly from voltage, which is unreliable on the flat LiFePO4 curve. A dedicated shunt monitor counts actual amp-hours in and out for a far more honest reading, and it re-syncs to 100% on every full charge.
What is the most accurate way to read battery state of charge?
Coulomb counting through a precision shunt, such as a Victron SmartShunt or BMV-712. It measures every amp flowing in and out and integrates that over time, then recalibrates to 100% when the bank reaches a settled full charge. Voltage-only gauges cannot resolve the LFP plateau.
What is the difference between CAN bus and RS485 for battery monitoring?
CAN bus is mainly used for closed-loop communication between a BMS and a compatible inverter, letting the inverter use real SoC and current limits. RS485 (often Modbus) is the workhorse for pulling data out to a logger or single-board computer. Many BMS boards offer both.
Can I monitor my home battery bank remotely?
Yes. The simplest route is a vendor cloud like Victron’s free VRM portal. Alternatively you can self-host a Grafana or Home Assistant dashboard and expose it securely. Either way, configure push alerts for low SoC, high cell-voltage delta, and over-temperature.
How often should I calibrate my battery monitor?
Let the bank reach a genuine full charge often enough that the monitor’s charged-detection fires and resets the count. With regular full charges that happens automatically. If you cycle only partially for weeks, do a deliberate full charge roughly monthly to clear accumulated counting error.
Is Grafana overkill for a small home battery system?
For a small fridge-and-lights bank, a shunt monitor is usually enough. Grafana and InfluxDB earn their place once you want months of history to catch slow cell drift, correlate solar yield against depth of discharge, or prove a charge-profile change actually helped.