Important Disclaimer
BatteryStorageHQ provides educational content and estimates only. We are not certified installers, financial advisors, or electricians. Always consult with licensed professionals.
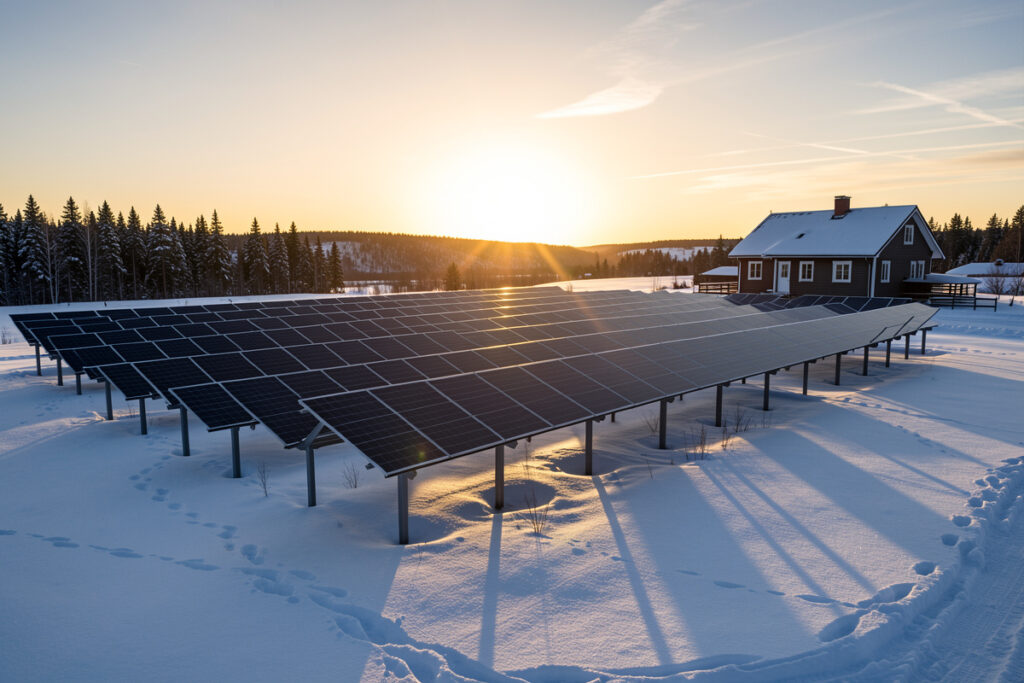
The first winter I relied on my own array, I made the rookie mistake of checking the Home Assistant production graph in late November the way I had all summer — expecting a number, getting a rounding error. A 400 W panel that had cheerfully handed me close to 2 kWh on a long June day was giving back two or three hundred watt-hours, on a good day. On a bad one, barely enough to register. That collapse — not the cold itself, but the sheer disappearance of production — is the thing every northern solar owner has to plan around, and almost no consumer marketing is honest about its scale.
This is the production half of the winter problem. The chemistry of how a cold cell behaves I cover in LiFePO4 cold-weather performance; here I want to walk through what actually happens to the watt-hours coming off the glass, why it is so much worse than people expect, and how to plan with the real numbers instead of the brochure ones. It all ties back into the broader winter solar storage guide.
Nameplate is a summer-noon number
A panel’s rated wattage is measured under Standard Test Conditions: 1,000 W/m² of light, the cell at 25°C, a specific spectrum. That is essentially a clear summer noon with the sun high. Your panel almost never sees those conditions in a northern December, and the gap is not a small correction — it is the whole story.
The honest planning unit is not watts, it is watt-hours per day, and the cleanest way to estimate it is panel wattage multiplied by your location’s peak sun hours for that month, then knocked down by real-world system losses. In summer my site behaves like 5 to 6 peak sun hours; in deep December a typical overcast day behaves like well under 1, and a properly grey stretch closer to 0.3. Run the same panel through both and the daily harvest difference is roughly an order of magnitude. The panel did not change. The sky did.
Why winter output collapses so far
Three independent reductions stack on top of each other, which is why the result is so much worse than any single one of them sounds.
Short days. At high latitude a December day might offer six or seven hours of any daylight at all, against sixteen-plus in June. Fewer hours of production to begin with.
Low sun angle. This one does double damage. A sun that never climbs far above the horizon means light passes through far more atmosphere on its way to your roof — a longer air mass that scatters and absorbs more of it — and it strikes a normally-tilted panel at a glancing angle, so even the light that arrives hits the glass inefficiently. Midday in December is not a weak version of midday in June; it is structurally dimmer.
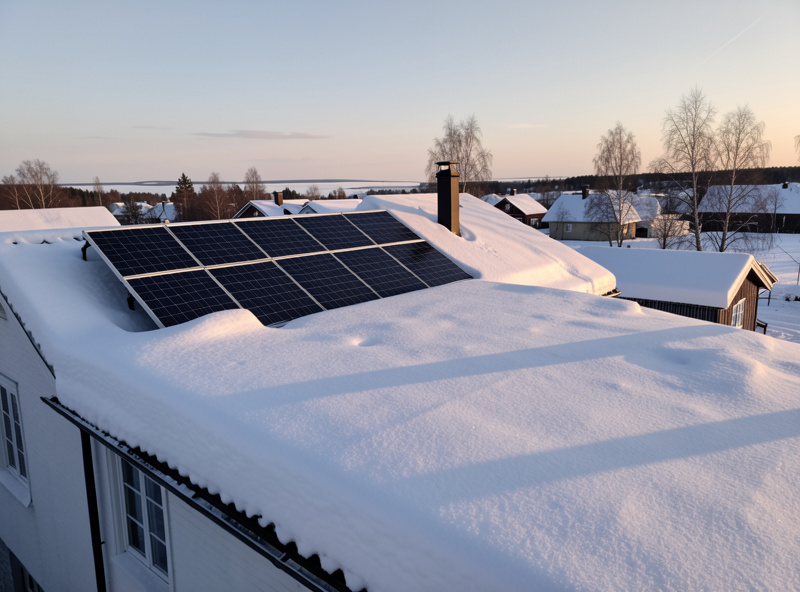
Cloud and weather. The same season that brings short days at my latitude brings persistent low cloud. A lot of those already-few, already-weak hours are diffuse rather than direct sunlight, which a panel converts far less of. And then there is snow — a panel under even a thin layer of snow makes essentially nothing until it clears.
Multiply three reductions together and you land at the eighth-to-a-tenth figure that shocks people their first winter. Critically, none of these is a fault you can fix by buying a better panel. They are geometry and weather. A more efficient panel makes a proportionally bigger number, but the proportion of summer-to-winter stays brutal.
What actually helps (and what doesn’t)
You cannot conjure photons, but you can stop throwing away the ones that do arrive. A few moves genuinely move the December number; others are summer optimisations that do nothing in winter.
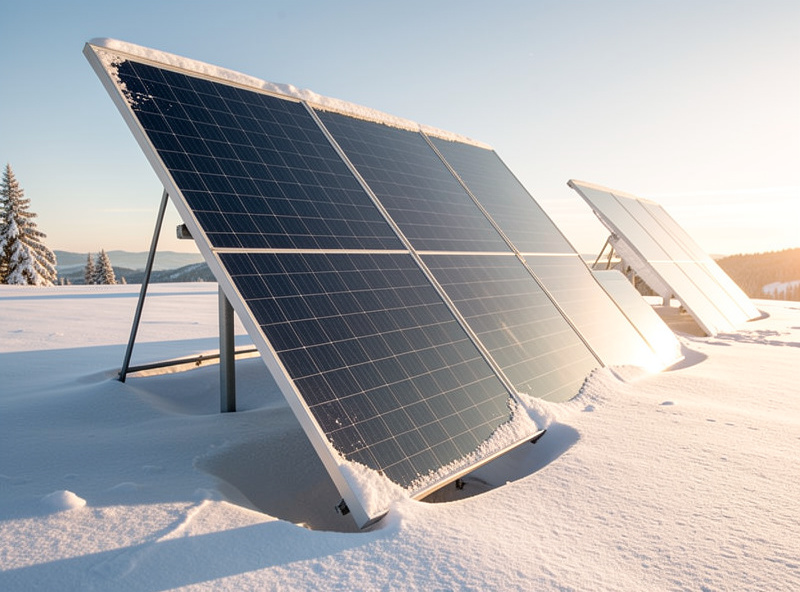
Tilt steeper for winter. This is the single best free lever. A panel angled for the low winter sun — much steeper than the summer-optimal angle, often approaching vertical at high latitude — presents itself more squarely to that glancing light and, just as importantly, sheds snow instead of holding it. A flat-ish summer tilt is a snow shelf. If your mount allows seasonal adjustment, the winter setting earns its keep.
Keep the glass clear. Snow on a panel is a total loss, not a partial one. Steep tilt does most of the work; for the rest, accessible panels you can sweep beat ones you cannot reach. I would rather mount where I can clear snow than chase a few percent of summer angle on an unreachable roof.
Avoid winter shading you ignored in summer. The low sun casts long shadows. A tree line or a roofline that never touched the array in July can shade it for the whole short winter day. Walk the site in December, not June.
What doesn’t help: chasing the last degree of summer-optimal tilt, oversizing the array to “make up” December (past a point those extra panels give almost nothing back in winter and sit idle all summer), or assuming a bigger inverter changes anything — the bottleneck is incoming light, full stop.
Planning with the real numbers
Here is the workflow I actually use, and the one I would put in front of anyone sizing a northern system. The general arithmetic lives in my solar sizing calculator; the winter twist is which month you feed it.
- Find your worst realistic month’s PSH. Not the annual average — December (or your darkest month). Local solar data or a year of your own logging will give it to you.
- Estimate daily Wh: array watts × worst-month PSH × a real-world derate for losses. The result is sobering and correct.
- Compare it to your daily load. The gap between what the array makes in deep winter and what you actually use is the number that defines your whole architecture.
- Decide how to fill the gap. Storage rides you through nights and short cloudy spells; a backup source (grid or generator) covers the deep weeks where the array simply cannot. Pretending storage alone closes a multi-week December gap is how banks go flat at 3 a.m.
Do this and the winter stops being a nasty surprise and becomes a designed-for condition. The array still does the heavy lifting eight months of the year — that is real and worth having. You just stop asking it to do something the sky will not let it do in January.
Measure your own collapse before you trust anyone’s averages
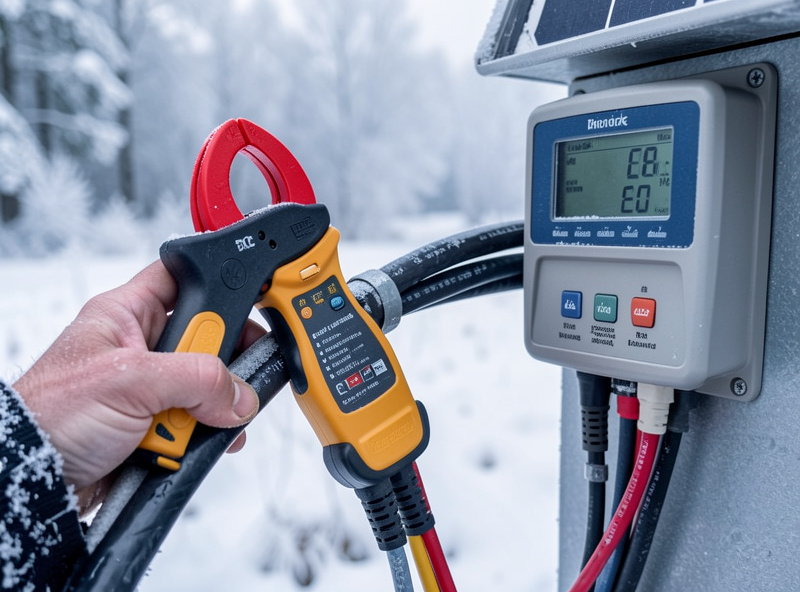
The single most useful thing I did was stop guessing and start logging. Public PSH tables are fine for a first estimate, but your site has its own microclimate — that tree line, that hill, that habitual valley fog — and a winter of real data beats any table. You do not need an expensive setup to capture it. A clamp meter tells you instantaneous current; an inline energy meter or a shunt-based battery monitor on the charge line tells you the cumulative watt-hours the array actually delivered each day, which is the number that matters. I feed mine into Home Assistant, but even a standalone display that totals daily Wh will reveal the truth of your December far better than a spec sheet.
If you want a cheap, honest way to start measuring household and charge-side energy, an inline energy meter is the tool I reach for first — it is the difference between a guess and a plan:
As an Amazon Associate I earn from qualifying purchases. The links below are gear I would genuinely reach for; they cost you nothing extra.
- Plug-in energy meter (kWh monitor) — log real daily consumption so your winter gap math uses true loads, not estimates.
- DC clamp meter — check instantaneous array current on a clear winter morning to see how far below nameplate you really are.
A season of logging turns abstract dread into a spreadsheet you can size against. That is the whole game.
How my own array behaves, month to month
For grounding, here is the shape of it on my roof, logged through Home Assistant across real winters. Midsummer days routinely top out several times my deep-winter best; the spring and autumn shoulders are surprisingly productive and do a lot to refill the bank between dark spells; and the December–January window is the genuine floor where the generator earns its place in the plan. The numbers are mine and my latitude’s — yours will differ — but the shape, that steep-sided winter trough, is universal this far north. Plan for the trough and everything above it is gravy.
Frequently asked questions
How much do solar panels actually produce in winter?
At high latitude, deep-winter daily output can fall to roughly an eighth to a tenth of a good summer day. The driver is peak sun hours collapsing — short days, low sun angle, and cloud stacking together — not the cold itself. Plan on watt-hours per day from your darkest month’s peak sun hours, never on nameplate watts.
Why is winter solar output so much lower than the cold alone would suggest?
Three reductions multiply: fewer daylight hours, a low sun angle that means more atmosphere and a glancing strike on the panel, and more cloud and snow. Each is modest alone; together they produce the order-of-magnitude drop. None of them is fixable with a better panel — they are geometry and weather.
Does tilting panels steeper really help in winter?
Yes, and it is the best free lever. A steeper winter tilt presents the panel more squarely to the low sun and, just as valuably, sheds snow instead of holding it. At high latitude the winter-optimal angle can approach vertical. A flat-ish summer tilt becomes a snow shelf that makes nothing until cleared.
Can I just add more panels to cover winter?
Only up to a point. Past a sane ceiling, extra panels give almost nothing back in deep winter because the bottleneck is incoming light, and they then sit idle all summer. Beyond that ceiling a backup source — grid or generator — is cheaper and more reliable than another array.
How do I plan a system around the winter drop?
Size on your darkest month, not the annual average. Estimate daily watt-hours as array watts times worst-month peak sun hours times a real-world derate, compare that to your daily load, and design storage to cover nights and short gaps with a backup source for the deep weeks. The annual average hides the December that starves the bank.